
Selected work
Case studies
Each project follows the same path: define the question, prepare the data, build the dashboard, then say what the business should do next. Click any dashboard to view it full size.
Coffee Shop Sales Analysis
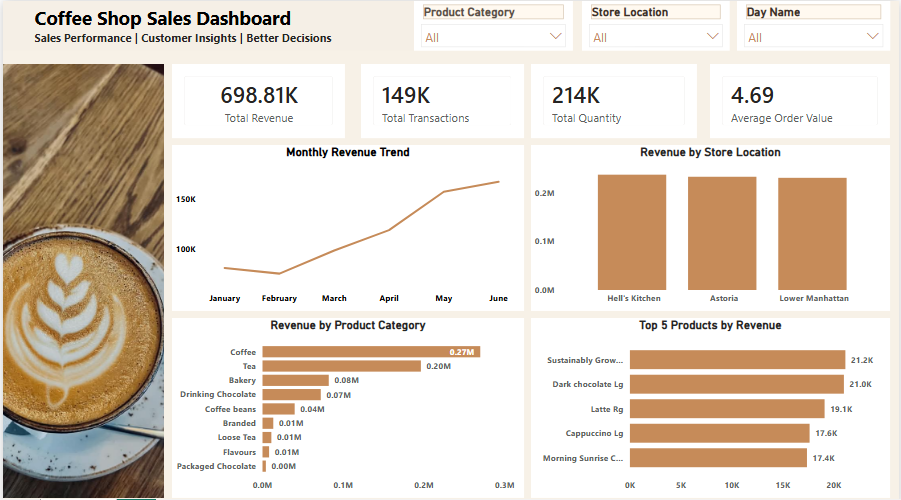
Analysed coffee shop sales to understand revenue performance, product demand and how customers buy across three New York store locations.
 View full size
Revenue698.81K
Transactions149K
Items sold214K
Avg order4.69
What the data showed
- Steady growth: revenue climbed from a February low to its highest point in June.
- Even stores: Hell's Kitchen led, with Astoria and Lower Manhattan close behind.
- Coffee leads: coffee brought in 0.27M, followed by tea at 0.20M.
- Top products: Sustainably Grown coffee and Dark Chocolate (Lg), then Latte and Cappuccino.
Areas analysed
Monthly revenue trendRevenue by storeRevenue by categoryTop 5 productsAverage order value
RecommendationPromote the best sellers, keep popular categories well stocked, and copy what works at Hell's Kitchen across the other stores. Look into February's dip and use targeted promotions to keep growth going.
Bakery Shop Sales Analysis
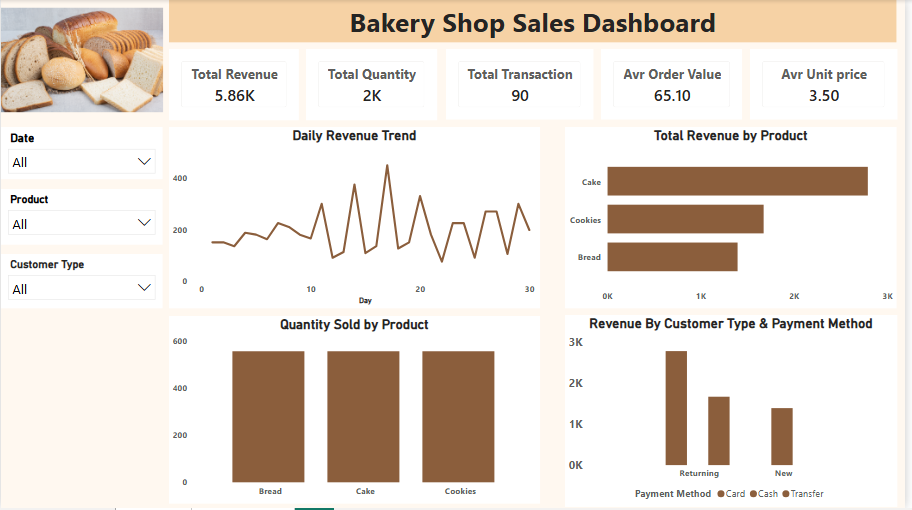
Analysed bakery sales to understand transaction performance, daily sales patterns, product demand, and how new and returning customers pay.
 View full size
Revenue5.86K
Transactions90
Items sold~2K
Avg order65.10
What the data showed
- Cake earns most: highest revenue, followed by cookies and bread.
- Same volume, different value: all three products sold in similar quantities, so price drives the revenue gap.
- Uneven days: daily revenue swung sharply across the month.
- Loyalty pays: returning customers spent more than new ones.
Areas analysed
Daily revenue trendRevenue by productQuantity by productCustomer typePayment method
RecommendationPush the high-revenue products, run offers on slow days, and start a loyalty programme to keep returning customers while attracting new ones.
Mobile Sales Analysis
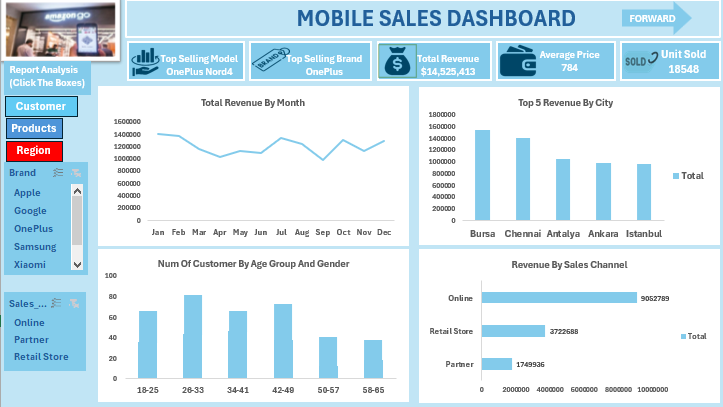
An interactive, four-page Excel report on smartphone sales: brand and model performance, customer profiles, storage preferences, and how sales vary by country and city.
 View full size
Revenue$14.53M
Units sold18,548
Avg price$784
Top modelNord 4
What the data showed
- OnePlus leads: top brand, with the OnePlus Nord 4 as the best-selling model.
- Online dominates: $9.05M online against $3.72M retail and $1.75M through partners.
- Bursa is the top city for units, revenue and customers; Chennai and Antalya follow.
- India and Turkey hold the largest customer bases.
- Seasonality: peaks in January, August, October and December; September is weakest.
- Buyers: spread across ages, strongest in the 26–33 and 42–49 groups; 256GB and 64GB sell best.
Areas analysed
Brand & modelUnits soldRevenueAverage priceAge & genderStorage & colourSales channelCountry & city
RecommendationInvest in the online channel, prioritise stock of OnePlus and higher-storage models, and focus growth efforts on India and Turkey, with Bursa, Chennai and Antalya as lead cities.
How I work
Clean data first, then insight
Most of the work happens before the first chart. This is the order I prepare a dataset before any analysis.
- CollectionGather data from files, surveys and exports.
- InspectionProfile columns, ranges and record counts.
- CleaningRemove duplicates, fix entry errors.
- Type correctionDates, currency and numbers stored correctly.
- Missing valuesFind gaps and decide how to treat them.
- TransformationDerive measures, categories and time fields.
- IntegrationJoin tables into one reliable model.
- ValidationReconcile totals before anything is shared.
Then analysis & reporting
Exploratory data analysisKPI analysisTrend analysisComparative analysisDashboard developmentData visualizationBusiness insightsRecommendations
Toolkit
Skills
Business analytics tools, backed by formal training in statistics and population research.
Tools
- Microsoft Excel PivotTables, VLOOKUP, modelling
- Power BI dashboards, KPIs
- SQL querying
- SPSS statistical analysis
- Microsoft Office Suite reporting
Analysis
- Data cleaning prep
- Exploratory data analysis EDA
- Descriptive statistics summary
- Sales & customer analysis business
- KPI & performance reporting dashboards
Research methods
- Quantitative research design methods
- Survey design & analysis questionnaires
- Hypothesis testing inference
- Demographic estimation population
- Population projection forecasting
Education & training
Background
A statistics degree and ongoing professional training in analytics.
- Certificate
Data Analysis with SPSS
UNIFECS, Obafemi Awolowo University. Practical statistical analysis, hypothesis testing and interpreting results in SPSS.
- Certificate
Data Analytics Essentials
Cisco Networking Academy. Foundational analytics principles, tools and workflows.
- Degree
B.Sc. (Hons.) Demography and Social Statistics
Federal University Oye-Ekiti. Coursework in demographic estimation, population projection, social statistics and computer applications in population analysis.
- Programme
Annual Final Year Student Programme
Federal University Oye-Ekiti with the United Nations Population Fund (UNFPA). Population data and development.